
贪心学院机器学习第一讲–线性回归
3 人赞同了该文章
课程总结:

Part1:初步了解机器学习
机器学习中包含监督学习和非监督学习,其中监督学习:数据存在标签,对标签进行学习,生成算法模型,然后通过算法对输入进行分类或回归(即生成输出)
1、分类使用领域:垃圾邮件、手写字符识别、医疗图像症状诊断…(非黑即白)
2、回归使用领域:自动估价二手车、股票价格预测、预测天气、自动驾驶…(连续值)
非监督学习:数据中不存在标签,根据属性对对象进行聚类
监督学习和非监督学习的主要区别:对输出是否有预期
Part2:机器学习的流程:
1、数据获取
2、数据清洗
3、特征工程(提取特征)
4、数据预处理(数据范围、格式)
特征提取处理缺失数据(删除、估计补全;使用均值、中间值代替;使用众数;聚类)数据定标(归一化x=(x-xmin)/(xmax-xmin),即转为0-1、标准化x=(x-u)/c,均值为0方差为1)数据转换(One-Hot encoding:用数字表达输入)
5、选择机器学习模型
6、模型训练
7、模型调参(对模型进行优化,参数调整或者模型修改等,迭代调优)
8、模型部署(生产环境、运行代码)
Part3:线性回归(Linear Regression):
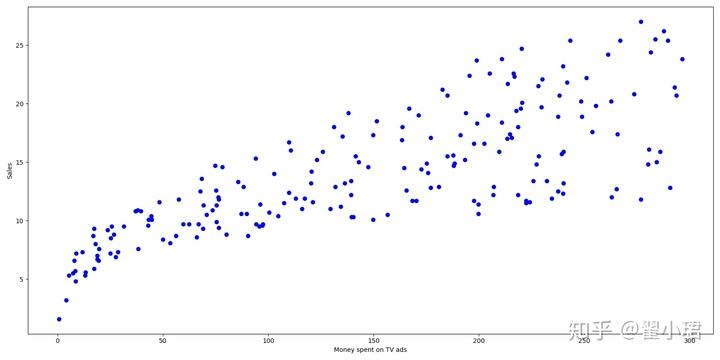
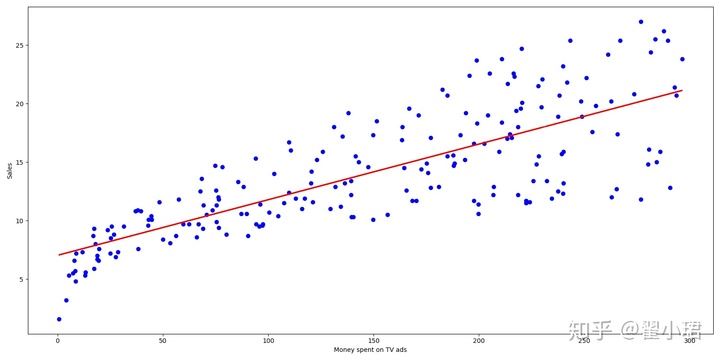
例:做产品广告:电视广告投入x(百万)、产品销量y(亿),估计x与y的关系。
假设两者为线性关系,y=ax+b
PS 常用库:
1、pandas 常用于读取数据并对数据进行处理
2、numpy 线性代数的计算
3、matplotlib 图表,对数据可视化(多用pyplot)
4、机器学习经典的算法库之一–sklearn(线性回归模型linear_model LinearReg-
ression)
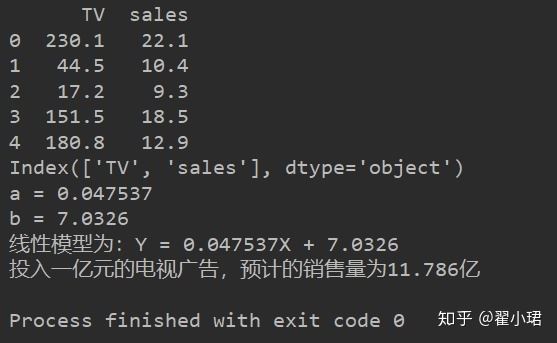
'''评估广告投入量(亿元)与产品销量(百万)之间的线性关系'''# 1调包import pandas as pd #获取数据import numpy as np #对数据进行处理(计算)import matplotlib.pyplot as plt #可视化(图表)from sklearn.linear_model import LinearRegression#2打开文件并读取data = pd.read_csv(r'C:\Users\翟小翟\Desktop\Machine-Learning-master\1introduction\data/Advertising.csv')a = data.head #如果不传数字进去,则默认选取前8个print(a)b = data.columns #读取数据列表名print(b)#3画图plt.figure(figsize=(16, 8))plt.scatter(data['TV'], data['sales'], c='blue')plt.xlabel('Money spent on TV ads')plt.ylabel('Sales')plt.show#4对数据进行训练,生成模型x = data['TV'].values.reshape(-1, 1)y = data['sales'].values.reshape(-1, 1)reg = LinearRegressionreg.fit(x, y)#5输出参数值print('a = {:.5}'.format(reg.coef_[0][0]))print('b = {:.5}'.format(reg.intercept_[0]))print('线性模型为:Y = {:.5}X + {:.5}'.format(reg.coef_[0][0], reg.intercept_[0]))#画图表predictions = reg.predict(x)plt.figure(figsize=(16, 8))plt.scatter(data['TV'], data['sales'], c='blue')plt.plot(data['TV'], predictions, c='red', linewidth=2)plt.xlabel('Money spent on TV ads')plt.ylabel('Sales')plt.show#进行预测predictions = reg.predict([[100]])print('投入一亿元的电视广告,预计的销售量为{:.5}亿'.format(predictions[0][0]))
输出结果:
作业:根据海拔预测气温'''调用需要使用的包'''import pandas as pd import numpy as npimport matplotlib.pyplot as pltfrom sklearn.linear_model import LinearRegression #1打开文件data = pd.read_csv(r'C:\Users\翟小翟\Desktop\Machine-Learning-master\1introduction\exercise\height.vs.temperature.csv')#2输出文件列名b = data.columns print(b) #3数据类型转换,训练数据x = data['height'].values.reshape(-1, 1) y = data['temperature'].values.reshape(-1, 1)